Operations
Every location side by side, same-store year over year, cancellations by reason and trends, to judge performance and decide what to do next.

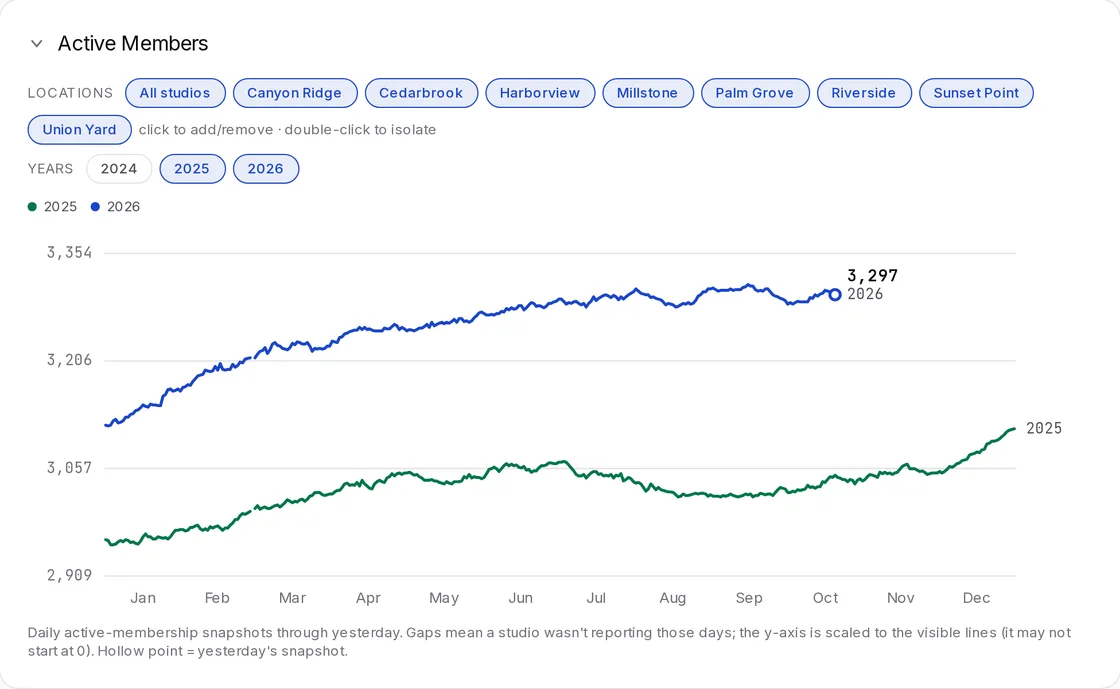
Each location's members day by day, with last year's line beside it, for one location or all of them.
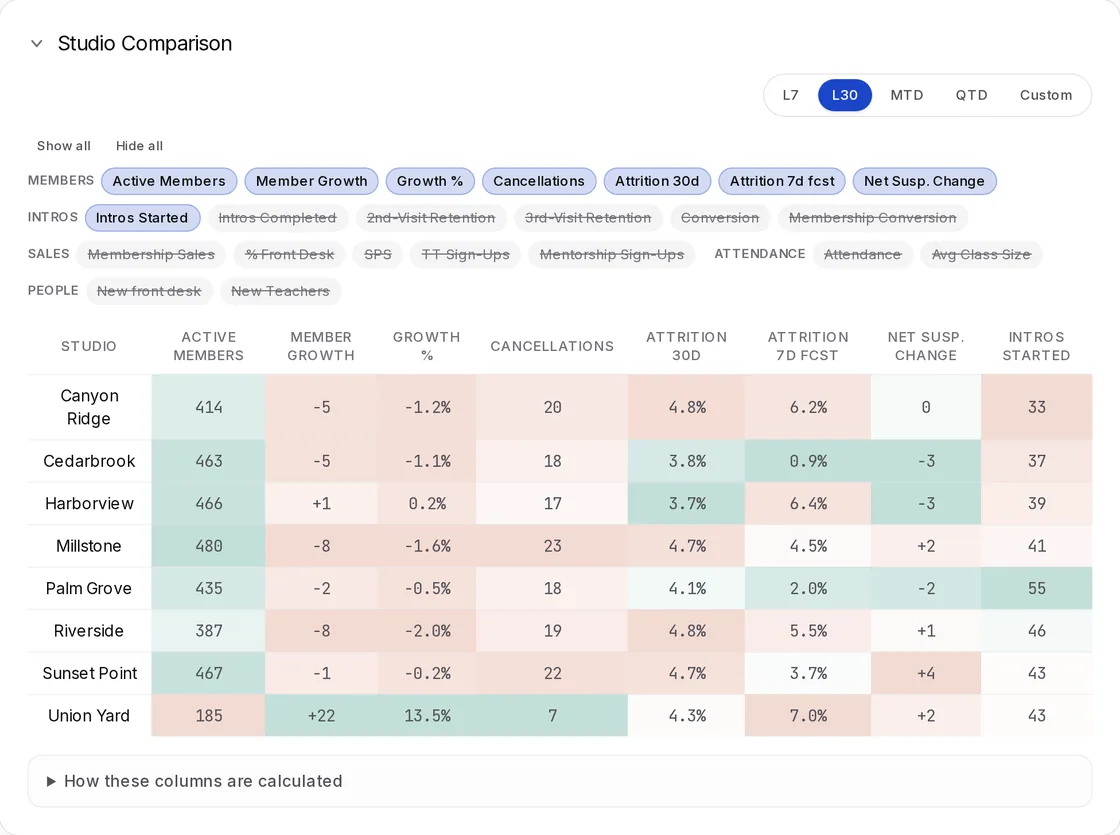
Members, growth, cancellations, attrition, intro offers, sales and attendance in one table, shaded from best to worst, for any date range.
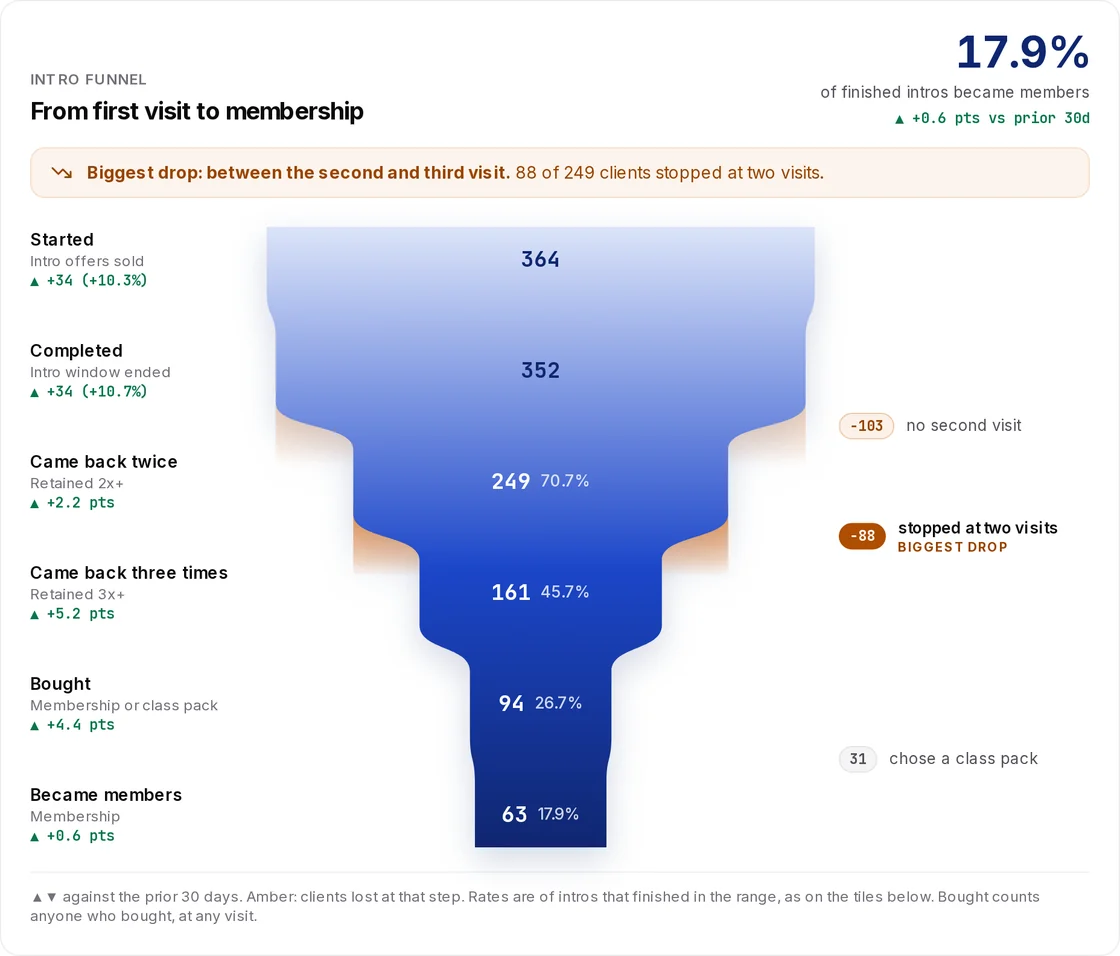
Every step from intro offer to membership against the prior period, with the step that loses the most clients named.
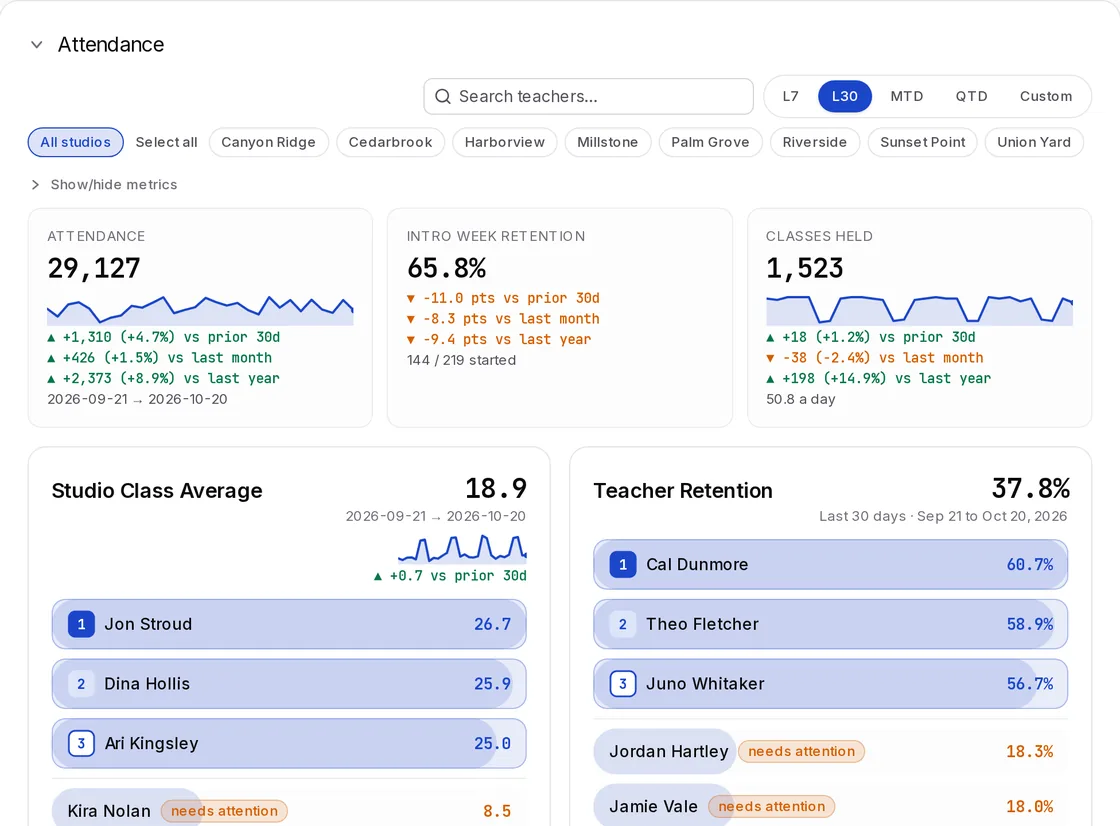
Class size and client retention ranked by teacher, with a flag on anyone who needs attention.
Fill rate by weekday and hour, for one location or all of them. Narrow it to a class style or a teacher, and open any slot for the classes behind it.
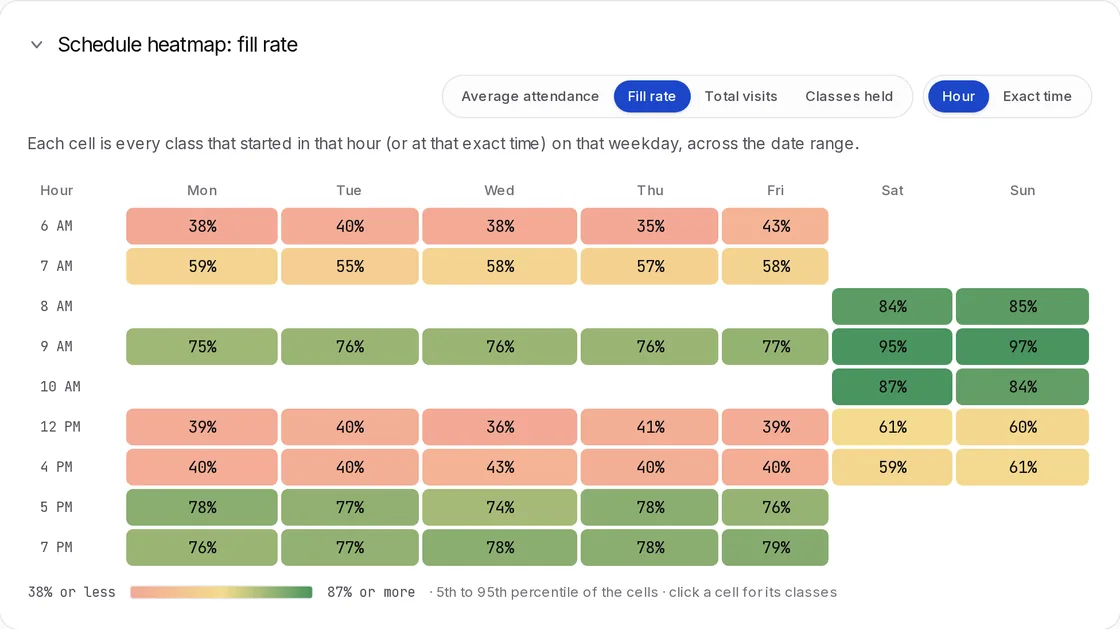
Choose the dates, locations, class styles and teachers; every figure shows its change against the period before and last year.
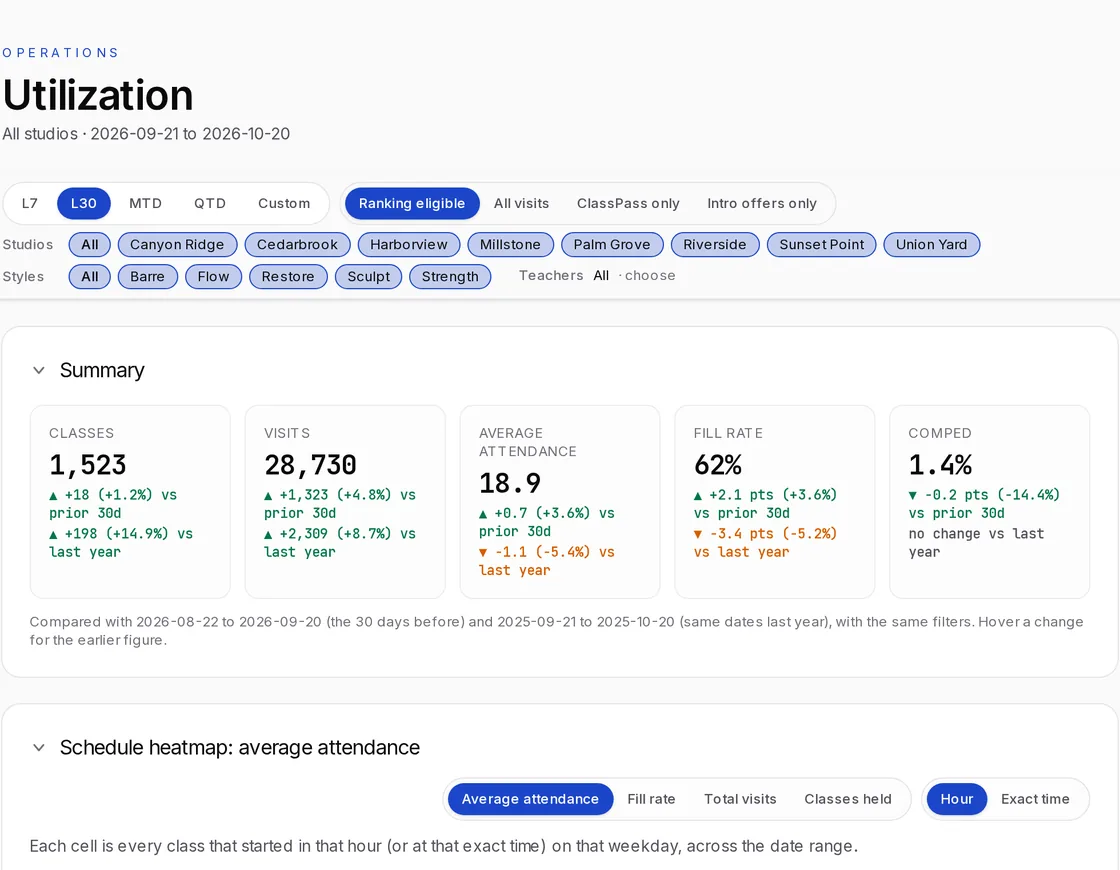
Goals for the day, week and month, the top three sellers, and the manager's note for the team, on the desk screen or a phone.

Sales per shift against the team, earnings by pay period, and every sale with its status, so nobody has to ask.
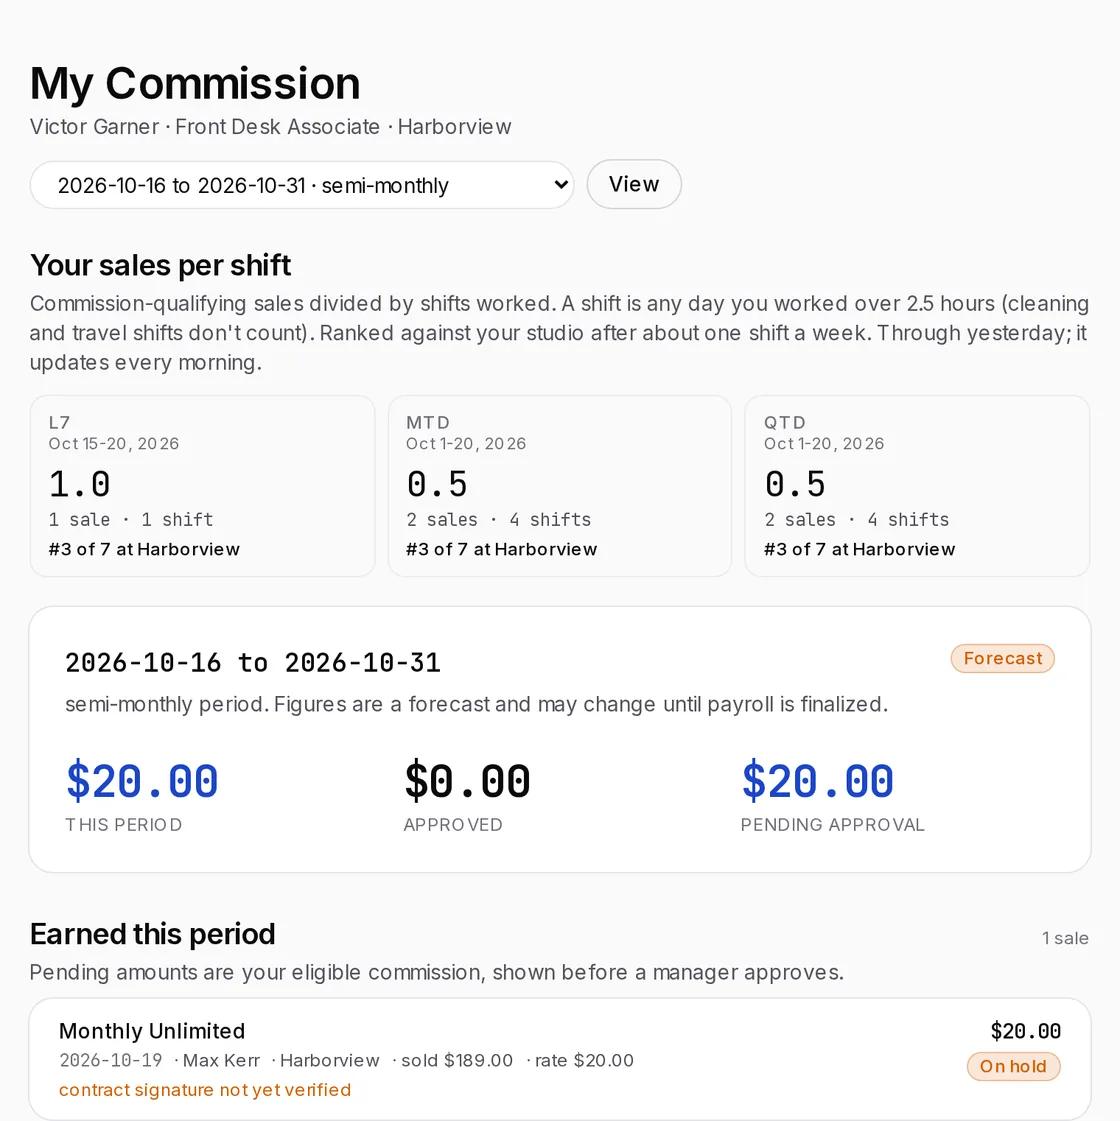
The rate card and review terms sit beside the queue. Clean sales approve in one click, and approved commissions go to payroll as one file.
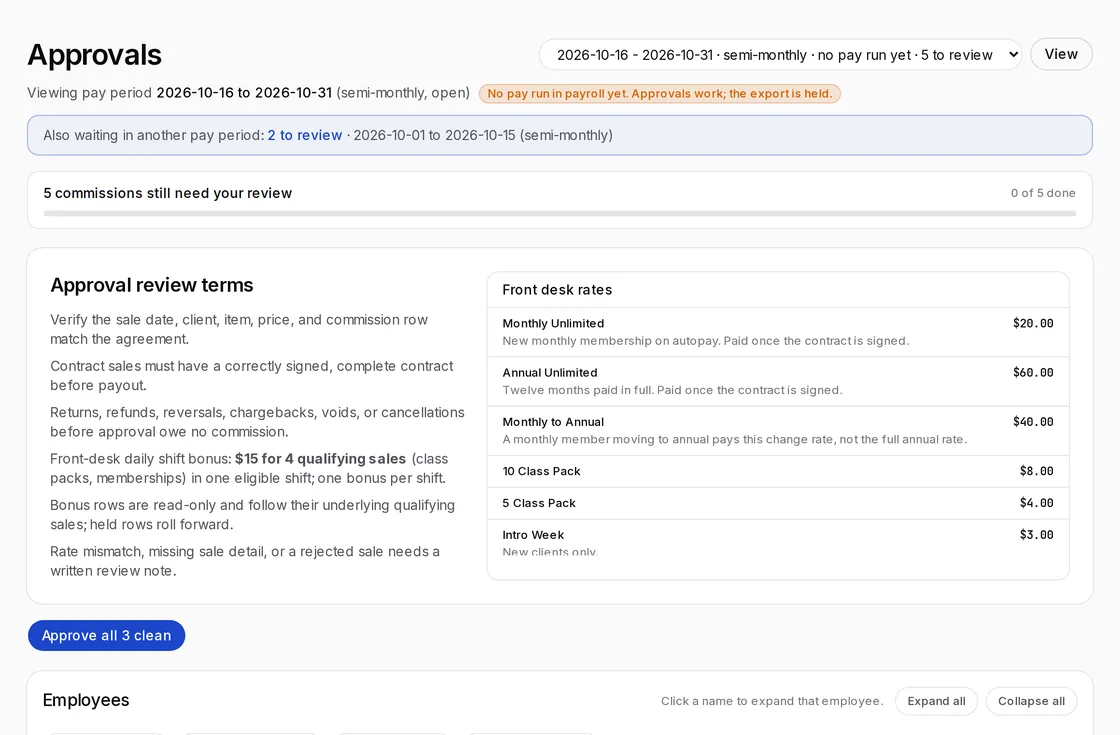
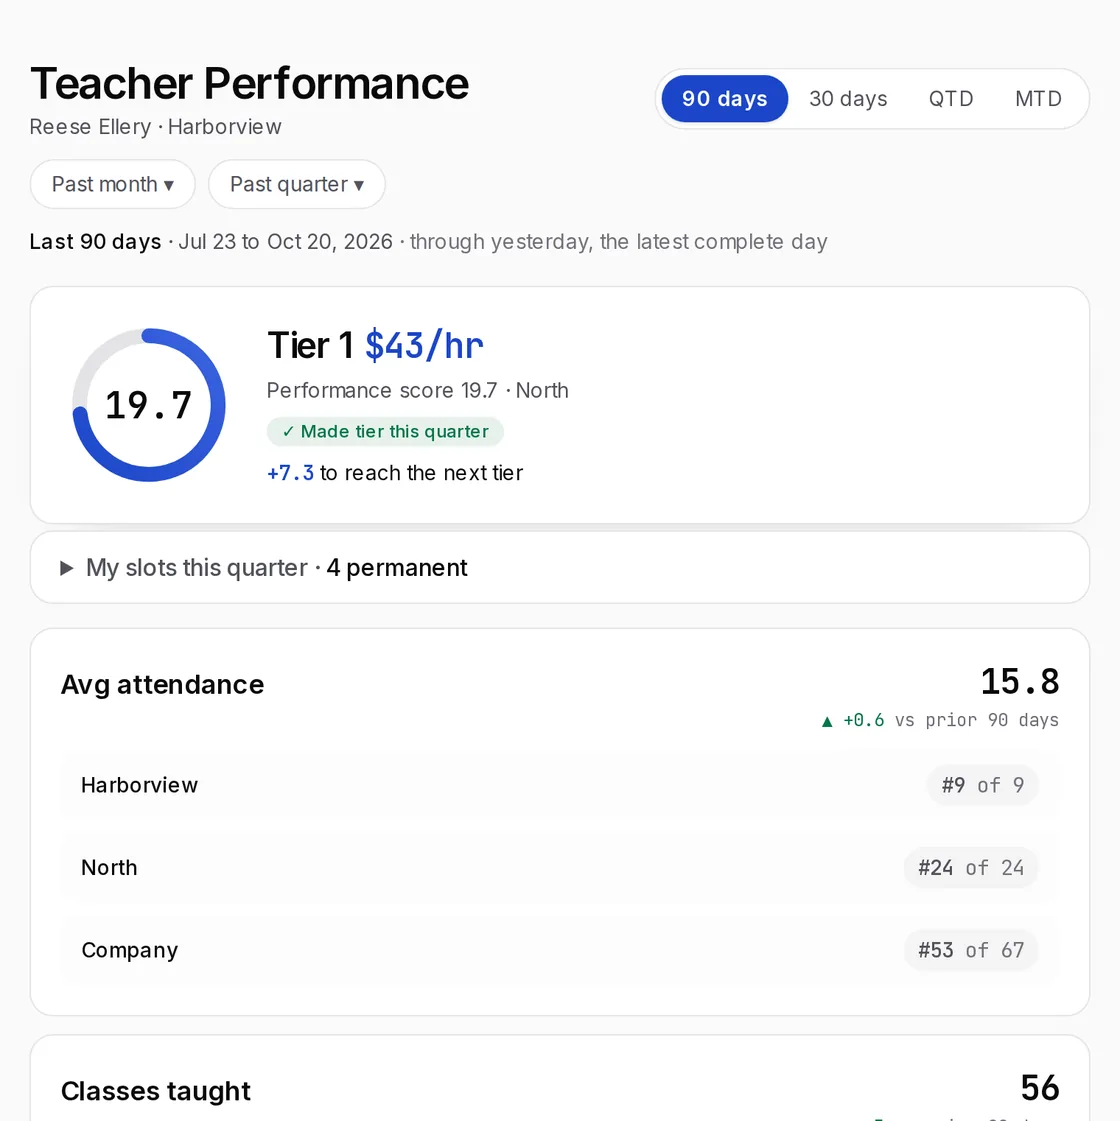
Their score, what it takes to reach the next tier, and their rank in their location, region and company. Other teachers' names stay hidden.
Roles come from job titles in your HR system, so access changes when someone is promoted or leaves.
| Role | Location dashboards | Commissions | Rank and pay tier | Marketing | Survey results |
|---|---|---|---|---|---|
| Front desk | No | Their own | No | No | No |
| Teacher or provider | No | No | Their own | No | No |
| Location manager | Their location | Approve their team | Their team | No | Their location, groups of 5+ |
| Marketing | No | No | No | Yes | No |
| HR | No | Payroll file | No | No | Company, groups of 5+ |
| Leadership | Every location | Every location | Every location | Yes | Company, groups of 5+ |
Every location side by side, same-store year over year, cancellations by reason and trends, to judge performance and decide what to do next.
Spend against every new client, by channel and location, to track campaigns and shape strategy, with marketing measurement behind it.
A sales board at each location, with goals for the day, week and month. Each person sees their own sales and commissions, approved on the commission desk.
Their own stats and rank in their location, region and company, and how close they are to the next pay tier. Other people's names stay hidden.
Approved commissions go to payroll as one file, and no sale is paid twice. Staff surveys go out by email or text, with results only for groups of 5 or more.
Leaders ask questions and get answers only from figures that tested code already calculated, within their own access, as with our AI agents.
Everything lives in your own secure data warehouse, and access follows least privilege: each role sees only what its job needs.
The portal reads from your own data warehouse. If you don't have one, we set one up as part of the implementation.
Only active employees can sign in, with their work email. People who leave lose access automatically.
Managers see their own locations. Sensitive pages can be limited to named people. Admins can preview what someone sees but can't act as them.
A person, their manager and the location board always show the same figure, worked out by the same rules.
If a source falls more than a day behind, the page shows a warning instead of passing old numbers off as current.
Code calculates every figure. AI never sets a number: it only sorts written notes, like cancellation reasons, into categories you set, and names are removed before any model sees them.
For owners and managers.
For everyone on staff, by role.
Your booking, payroll and HR systems feed your warehouse. If you already run our Data Engine, the Suite reads from it.
We map each job title to what it can see and do, with you, and you approve it.
Leadership first, then managers, then everyone, checking each figure against what you use today.
At the multi-state business where we built it, every department uses it, most of them every day. See the full case study
Tempo gives owners and managers dashboards for their locations, on data we host. Tempo Suite is for everyone on staff, each by role, on your own data warehouse, with sales boards, commissions, rankings and surveys.
Yes. If you don't have one, we set it up as part of the implementation, and keeping it running is part of your quote.
With their work email. Only active employees in your HR system get in, and access ends when someone leaves.
Answers are confidential, not anonymous: results appear only for groups of 5 or more, and no screen shows who wrote what.
Code calculates every figure; AI never sets a number. AI sorts written notes, like cancellation reasons, into categories you set. When leaders ask a question, it answers only from figures that tested code already calculated, and a check matches each number before they see it. Names are removed before any model sees the text.
A setup fee for the implementation, including your warehouse if you need one, then a monthly fee. Quoted once we've seen your company: how many locations, people and systems.
Tell us how your teams work today and which systems you use. We'll reply with how we'd set it up.